Wednesday, December 8, 2021

The Modern Microservice

 Microservices can be deployed individually on separate servers provisioned with fewer resources - only what is required by each service and the host system itself, helping to lower compute resource expenses.

Microservices-based architecture is aligned with Event-driven Architecture and Service-Oriented Architecture (SOA) principles, where complex applications are composed of small independent processes which communicate with each other through APIs over a network. APIs allow access by other internal services of the same application or external, third-party services and applications.

Each microservice is developed and written in a modern programming language, selected to be the best suitable for the type of service and its business function. This offers a great deal of flexibility when matching microservices with specific hardware when required, allowing deployments on inexpensive commodity hardware.

Although the distributed nature of microservices adds complexity to the architecture, one of the greatest benefits of microservices is scalability. With the overall application becoming modular, each microservice can be scaled individually, either manually or automated through demand-based autoscaling.

Seamless upgrades and patching processes are other benefits of microservices architecture. There is virtually no downtime and no service disruption to clients because upgrades are rolled out seamlessly - one service at a time, rather than having to re-compile, re-build and re-start an entire monolithic application. As a result, businesses are able to develop and roll-out new features and updates a lot faster, in an agile approach, having separate teams focusing on separate features, thus being more productive and cost-effective.

Monolith to Microservices


  1. From Monolith to Microservices
  2. Introduction and Learning Objectives

Most new companies today run their business processes in the cloud. Newer startups and enterprises which realized early enough the direction technology was headed developed their applications for the cloud.

Not all companies were so fortunate. Some built their success decades ago on top of legacy technologies - monolithic applications with all components tightly coupled and almost impossible to separate, a nightmare to manage and deployed on super-expensive hardware.

If working for an organization which refers to their main business application "the black box”, where nobody knows what happens inside and most logic was never documented, leaving everyone clueless as to what and how things happen from the moment a request enters the application until a response comes out, and you are tasked to convert this business application into a cloud-ready set of applications, then you may be in for a very long and bumpy ride.


In time, the new features and improvements added to code complexity, making development more challenging - loading, compiling, and building times increase with every new update. However, there is some ease in administration as the application is running on a single server, ideally a Virtual Machine or a Mainframe.

monolith has a rather expensive taste in hardware. Being a large, single piece of software which continuously grows, it has to run on a single system which has to satisfy its compute, memory, storage, and networking requirements. The hardware of such capacity is both complex and extremely pricey.

Since the entire monolith application runs as a single process, the scaling of individual features of the monolith is almost impossible. It internally supports a hardcoded number of connections and operations. However, scaling the entire application can be achieved by manually deploying a new instance of the monolith on another server, typically behind a load balancing appliance - another pricey solution.

During upgrades, patches or migrations of the monolith application downtime is inevitable and maintenance windows have to be planned well in advance as disruptions in service are expected to impact clients. While there are third party solutions to minimize downtime to customers by setting up monolith applications in a highly available active/passive configuration, they introduce new challenges for system engineers to keep all systems at the same patch level and may introduce new possible licensing costs.


Thursday, December 2, 2021

Kubernetes Secrets


What are Kubernetes Secrets?
Introduction to K8s Secrets

The concept of Secrets refers to any type of confidential credential that requires privileged access with which to interact. These objects often act as keys or methods of authentication with protected computing resources in secure applications, tools, or computing environments. In this article, we are going to discuss how Kubernetes handles secrets and what makes a Kubernetes secret unique.

Why are Secrets Important?

In a distributed computing environment it is important that containerized applications remain ephemeral and do not share their resources with other pods. This is especially true in relation to PKI and other confidential resources that pods need to access external resources. For this reason, applications need a way to query their authentication methods externally without being held in the application itself.

Kubernetes offers a solution to this that follows the path of least privilege. Kubernetes Secrets act as separate objects which can be queried by the application Pod to provide credentials to the application for access to external resources. Secrets can only be accessed by Pods if they are explicitly part of a mounted volume or at the time when the Kubelet is pulling the image to be used for the Pod.

How Does Kubernetes Leverage Secrets?

The Kubernetes API provides various built-in secret types for a variety of use cases found in the wild. When you create a secret, you can declare its type by leveraging the `type` field of the Secret resource, or an equivalent `kubectl` command line flag. The Secret type is used for programmatic interaction with the Secret data.

Ways to create K8s Secrets

There are multiple ways to create a Kubernetes Secret.

Creating a Secret via kubectl

To create a secret via kubectl, you’re going to want to first create text file to store the contents of your secret, in this case a username.txt and password.txt:

echo -n 'admin' > ./username.txt
echo -n '1f2d1e2e67df' > ./password.txt

Then you’ll want to leverage the kubectl create secret to package these files into a Secret, with the final command looking like this:

kubectl create secret generic db-user-pass \
  --from-file=./username.txt \
  --from-file=./password.txt

The output should look like this:

secret/db-user-pass created

Creating a Secret from config file

You can also store your secure data in a JSON or YAML file and create a Secret object from that. The Secret resource contains two distinct maps:

  • data: used to store arbitrary data, encoded using base64
  • stringData: allows you to provide Secret data as unencoded strings

The keys of data and stringData must consist of alphanumeric characters, -, _ or ..

For example, to store two strings in a Secret using the data field, you can convert the strings to base64 as follows:

echo -n 'admin' | base64

The output should look like this:

YWRtaW4=

And for the next one:

echo -n '1f2d1e2e67df' | base64

The output should like similar to:

MWYyZDFlMmU2N2Rm

You can then write a secret config that looks like this:

apiVersion: v1
kind: Secret
metadata:
  name: mysecret
type: Opaque
data:
  username: YWRtaW4=
  password: MWYyZDFlMmU2N2Rm

Creating a secret using kustomize

You can also generate a Secret object by defining a secretGenerator in a kustomization.yaml file that references other existing files. For example, the following kustomization file references the ./username.txt and the ./password.txt files, for example:

secretGenerator:
- name: db-user-pass
  files:
  - username.txt
  - password.txt

Then apply the directory containing the kustomization.yaml to create the Secret:

kubectl apply -k .

The output should look similar to this:

secret/db-user-pass-96mffmfh4k created

Editing a Secret

You can edit an existing Secret with the following command:

kubectl edit secrets mysecret

This command opens the default configured editor and allows for updating the base64 encoded Secret values in the data field:

  # Please edit the object below. Lines beginning with a '#' will be ignored,
# and an empty file will abort the edit. If an error occurs while saving this file will be
# reopened with the relevant failures.
#
apiVersion: v1
data:
  username: YWRtaW4=
  password: MWYyZDFlMmU2N2Rm
kind: Secret
metadata:
  annotations:
    kubectl.kubernetes.io/last-applied-configuration: { ... }
  creationTimestamp: 2016-01-22T18:41:56Z
  name: mysecret
  namespace: default
  resourceVersion: "164619"
  uid: cfee02d6-c137-11e5-8d73-42010af00002
type: Opaque

How to Use Secrets

Secrets can be used in a variety of ways, such as being mounted as data volumes or exposed as environment variables to be used by a container in a Pod. Secrets can also be used by other parts of the system, without being directly exposed to the Pod. For example, Secrets can hold credentials that other parts of the system should use to interact with external systems on your behalf.

Using Secrets as environment variables

To use a secret in an environment variable in a Pod, you’ll want to:

  1. Create a secret or use an existing one. Multiple Pods can reference the same secret.
    1. Modify your Pod definition in each container that you wish to consume the value of a secret key to add an environment variable for each secret key you wish to consume. The environment variable that consumes the secret key should populate the secret’s name and key in env[].valueFrom.secretKeyRef.
  2. Modify your image and/or command line so that the program looks for values in the specified environment variables.

This is an example of a Pod that uses secrets from environment variables:

apiVersion: v1
kind: Pod
metadata:
  name: secret-env-pod
spec:
  containers:
  - name: mycontainer
    image: redis
    env:
      - name: SECRET_USERNAME
        valueFrom:
          secretKeyRef:
            name: mysecret
            key: username
      - name: SECRET_PASSWORD
        valueFrom:
          secretKeyRef:
            name: mysecret
            key: password
  restartPolicy: Never

Using Immutable Secrets

Kubernetes provides an option to set individual Secrets as immutable. For clusters that extensively use Secrets (at least tens of thousands of unique Secret to Pod mounts), preventing changes to their data has the following advantages:

  • protects you from accidental (or unwanted) updates that could cause applications outages
  • improves performance of your cluster by significantly reducing load on kube-apiserver, by closing watches for secrets marked as immutable.

This feature is controlled by the ImmutableEphemeralVolumes feature gate, which is enabled by default since v1.19. You can create an immutable Secret by setting the immutable field to true. For example:

apiVersion: v1
kind: Secret
metadata:
  ...
data:
  ...
immutable: true

Built-in Secret Types

  • Opaque Secrets – The default Secret type if omitted from a Secret configuration file.
  • Service account token Secrets – Used to store a token that identifies a service account. When using this Secret type, you need to ensure that the `kubernetes.io/service-account.name` annotation is set to an existing service account name.
  • Docker config Secrets – Stores the credentials for accessing a Docker registry for images.
  • Basic authentication Secret – Used for storing credentials needed for basic authentication. When using this Secret type, the `data` field of the Secret must contain the `username` and `password` keys
  • SSH authentication secrets – Used for storing data used in SSH authentication. When using this Secret type, you will have to specify a `ssh-privatekey` key-value pair in the `data` (or `stringData`) field as the SSH credential to use.
  • TLS secrets – For storing a certificate and its associated key that are typically used for TLS . This data is primarily used with TLS termination of the Ingress resource, but may be used with other resources or directly by a workload. When using this type of Secret, the `tls.key` and the `tls.crt` key must be provided in the data (or `stringData`) field of the Secret configuration
  • Bootstrap token Secrets – Used for tokens used during the node bootstrap process. It stores tokens used to sign well known ConfigMaps.

Conclusion

So now that you’ve had a brief introduction to what a secret is, you’re ready to learn how to use them in practice. Stay tuned to our blog where we’re going to be learning how to apply the concepts we learned here in a practical environment.

Kubernetes management


What is Kubernetes management?

An effective Kubernetes environment must include the ability to create, scale, update, and observe the clusters that run containers.

Why use Kubernetes?

For as long as there have been computers, there have been difficulties getting applications to run the same way in multiple locations. Developers even have a saying about it: “Well, it works on my machine.”

In the last few years, however, portability and repeatability have been less of a problem due to the use of containers, which effectively encapsulate everything an application needs to run and provide a relatively isolated environment in which that can happen.

Of course, containers bring their own difficulties: now that you’ve got your application running in all of these little boxes, how do you manage the little boxes? That’s where Kubernetes comes in.

How does Kubernetes work?

Kubernetes uses a series of nodes on which it schedules pods. Each pod can contain one or more containers, all of which can talk to each other via services.

Workloads are added to Kubernetes via YAML files, such as:

—
apiVersion: v1
kind: Pod
metadata:
 name: rss-site
 labels:
   app: web
spec:
 containers:
   – name: front-end
     image: nginx
     ports:
     – containerPort: 80
   – name: rss-reader
     image: nickchase/rss-php-nginx:v1
     ports:
     – containerPort: 88

When you add a workload to Kubernetes, the Kubernetes controller places it on a node and starts the pod. If you’ve requested multiple replicas, it creates multiple instances of that workload, assigning each of them unique names and potentially to different nodes.

Should something go wrong with one of those pods, Kubernetes automatically starts another instance to replace it.

Proper Kubernetes management ensures that these resources are available and provides information so you can detect problems before they cause downtime for your clusters.

How do you manage Kubernetes objects and components?

Kubernetes objects and components are managed in much the same way as Kubernetes- based applications: through YAML definition files. For example, to create a new service, we might define it as:

apiVersion: v1
kind: Service
metadata:
  name: rss-service
spec:
  selector:
    app: web
  ports:
    - protocol: TCP
      port: 80
      targetPort: 9376

We can then add it using kubectl:

kubectl create -f service.yaml

Kubernetes even enables you to create your own CustomResourceDefinitions, such as:

apiVersion: apiextensions.k8s.io/v1
kind: CustomResourceDefinition
metadata:
  name: crontabs.stable.example.com
spec:
  group: stable.example.com
  versions:
    - name: v1
      served: true
      storage: true
      schema:
        openAPIV3Schema:
          type: object
          properties:
            spec:
              type: object
              properties:
                cronSpec:
                  type: string
                image:
                  type: string
                replicas:
                  type: integer
  scope: Namespaced
  names:
    plural: crontabs
    singular: crontab
    kind: CronTab
    shortNames:
    - ct

These are also created and managed just like other Kubernetes objects, as in:

apiVersion: "stable.example.com/v1"
kind: CronTab
metadata:
  name: my-new-cron-object
spec:
  cronSpec: "* * * * */5"
  image: my-awesome-cron-image

The important thing to remember is that anything you do should be stored in a CVS or similar system for repeatability.

How do you manage Kubernetes clusters?

Managing Kubernetes clusters can be similar to managing Kubernetes objects, but it probably shouldn’t be. In other words, just because you CAN create a Kubernetes cluster with a YAML file doesn’t mean that you should.

Instead, you should use one of the many tools that exist for creating and managing Kubernetes clusters. What you use is going to depend on what you’re trying to achieve. Tools for managing Kubernetes include:

  • Desktop development tools such as Docker Desktop or kubeadm provide a relatively easy way to create a small Kubernetes cluster on your local machine, but aren’t suitable for a production application.
  • Managed public cloud Kubernetes optionssuch as Amazon Kubernetes Service or Google Kubernetes Service are (relatively) easy to set up and suitable for production use, but can ultimately lock you into their platform, as the actual management of your clusters is performed using proprietary APIs.
  • Enterprise Kubernetes management tools such as Mirantis Kubernetes Engine (formerly Docker Enterprise) enable you to run production-level Kubernetes clusters on existing infrastructure, such as bare metal, VMware, or OpenStack clusters.

Production Kubernetes management

Although it can be straightforward to deploy a development kubernetes cluster, a true enterprise-grade Kuberentes architecture requires a much greater degree of management.

Specifically, your Kubernetes management tool must be able to manage multiple Kubernetes clusters. In fact, an enterprise-grade Kubernetes management tool will enable you to create, scale, update, and observe clusters, potentially across multiple infrastructures, such as on-prem and public cloud.

An enterprise-grade Kubernetes management tool enables you to create a cluster by defining its parameters, such as the type and number of servers to act as nodes. For example, Mirantis Container Cloud enables you to define a cluster, choosing whether it should run on bare metal, AWS, OpenStack, VMware, and so on. Once you’ve done that, you can add machines to the cluster, and Container Cloud automatically provisions them from that infrastructure and deploys the appropriate software to those nodes.

To scale the cluster, you simply specify additional nodes, and the management tool adds them to the cluster.

In a true enterprise grade Kubernetes management system, upgrading should be just as straightforward; you should be able to specify the version of Kubernetes a cluster should be running and the Kubernetes Management system should perform the upgrade.

A Kubernetes management system should also provide Kubernetes visibility and observability — preferably with standard tools. The system should provide insights into aspects of cluster usage such as CPU load, available storage, and network load. In most cases, these insights will come from a Prometheus-based Kubernetes monitoring tool.

What is Kubernetes monitoring?


What is Kubernetes monitoring?

Kubernetes monitoring provides visibility into what's happening inside your cluster

Why Kubernetes monitoring is important

Kubernetes monitoring is the art of getting visibility and insight into what’s going on inside your Kubernetes clusters and applications. You’ll want to do this for several reasons, including:
  • Reliability and troubleshooting: Kubernetes applications — particularly those that take advantage of a cloud native or microservices architecture — can be especially complicated, and if something goes wrong, tracking down the source of the issue can be difficult. Appropriate Kubernetes visibility lets you see where issues may be occurring (or about to occur) and monitoring enables you to take action to prevent or resolve problems.
  • Kubernetes performance tuning: Knowing what’s going on inside your Kubernetes cluster will enable you to make decisions that make the most of your hardware without compromising the performance of your applications.
  • Cost management: If you’re running Kubernetes on a public cloud infrastructure, it’s important to keep track of how many nodes (servers) you’re running. Even if you’re not running in the public cloud, it’s important to know whether you’re over-resourced.
  • Chargebacks: In some situations, you will want to know what groups have used what resources, so Kubernetes monitoring can provide you information on usage statistics for the purpose of chargebacks or showbacks, or simply for Kubernetes cost analysis.
  • Security: In today’s environment it’s crucial to be able to know what’s running where, to spot extra jobs that shouldn’t be there, or to spot DOS attacks. Kubernetes monitoring can’t solve all of your security issues, but without it you’re at a definite disadvantage.
In order to properly monitor your applications and clusters, you need to make sure that you’ve got the appropriate level of Kubernetes visibility.

What visibility is required for Kubernetes monitoring?

Of course, you can’t monitor what you can’t see, so Kubernetes visibility is a huge part of Kubernetes monitoring. What you’re looking for is going to depend on the level at which you’re looking.
  • Container monitoring: At the container level, there’s not much you can look into besides the basics, such as how much CPU the container is using while it’s running. Containers are ephemeral, so once a container stops, you can’t log into it to see what’s going on.
  • Application monitoring: Your application is, of course, written by you, and doesn’t come with built-in monitoring hooks, but that means that you can expose any metrics that you feel are appropriate according to the business rules of the application. You’ll want to ensure that you do this in a persistent way by integrating with a monitoring system (we’ll get to that in a minute) rather than within the ephemeral environment of the container.
  • Pod monitoring: Pods have their own statistics, such as their state and the number of replicas running versus the number that were requested. You’ll want to keep track of that to watch for problems caused by misconfigurations or running out of resources.
  • Node monitoring: Your applications ultimately run on nodes, so it’s important to monitor those nodes to ensure that they’re healthy. Metrics that should be part of your Kubernetes monitoring include CPU utilization, storage availability, and network status.
  • Cluster monitoring: Kubernetes monitoring at the cluster level should be more than just an aggregation of metrics from the other levels. Ideally, you should have an overall view using some sort of dashboard that enables you to make sense of utilization and identify anomalies before they become issues.

Kubernetes and the Kubernetes community provide multiple ways to provide Kubernetes visibility and monitoring.

How to do Kubernetes monitoring

It’s important to understand that while the two are related, there is a difference between Kubernetes visibility and Kubernetes monitoring. Kubernetes visibility is how the data is made available by the application. Kubernetes monitoring is how it’s made available to a human. For example, Kubernetes provides a set of limited metrics such as CPU usage and memory usage via the in-memory metrics-server. This component collects information such as CPU and memory usage, and is how components such as the Horizontal Pod Autoscaler know what’s going on within the cluster. Kubernetes provides several ways to get this kind of “live” Kubernetes visibility, such as:

  • Kubernetes liveness and readiness probes: When you define a container in Kubernetes, you also have the ability to define a programmatic way to determine whether the container is ready, and whether it is still alive. Consider this example from the Kubernetes documentation:
apiVersion: v1
kind: Pod
metadata:
  labels:
    test: liveness
  name: liveness-exec
spec:
  containers:
  - name: liveness
    image: k8s.gcr.io/busybox
    args:
    - /bin/sh
    - -c
   - touch /tmp/healthy; sleep 30; rm -rf /tmp/healthy; sleep 600
   livenessProbe:
    exec:
      command:
     - cat 
     - /tmp/healthy 
   initialDelaySeconds: 5 
   periodSeconds: 5

In this case, Kubernetees will look for a /tmp/healthy file every 5 seconds, and if it doesn’t find one, it will assume the container has died and will kill it and create a new one. For this example, the container will appear to be healthy, and then, when the file is removed, it will appear to have crashed and will be replaced.

Kubernetes uses this information to determine the specific state of the container, but unless the actual probes are designed to do so, their information doesn’t connect to other systems, and is localized in influence to the container or pod.

  • kubernetes-metrics-server: This add-on component generates an in-memory look at the Kubernetes cluster as a whole, including pod statistics, memory and CPU usage, and so on, and can provide a stream of data to another application asking for it.
  • Kubernetes Dashboard: This is a separate component that you can install in order to see a live version of what’s going on inside your cluster. It lists workloads, nodes, and so on, and also enables you to take actions such as creating or destroying objects — so if you install it, ensure that your security is set up properly!

The problem with all of these solutions is that they are only a “live” view of what’s going on in the cluster; they don’t save this data, so there’s no way to use it to see trends or understand what happened before a catastrophic failure. To do that, we need to export all of those metrics from Kubernetes to some sort of time-series database such as InfluxDB, with a front end that enables you to create dashboards to see what’s going on.

One of the most popular ways to do Kubernetes monitoring is to use a tool called Prometheus with a GUI called Grafana. For example, Mirantis Stacklight uses these tools together to provide visibility into your Kubernetes clusters, precisely indicating which service caused a failure. It also provides built-in alerts on anomaly and fault detection (AFD) metrics that can be extended to create custom alerts. The alarms can be exported to other systems via standard protocols such as SNMP.

Interested in learning more about Kubernetes visibility and Kubernetes monitoring? Contact us and we’ll be happy to walk you through your options.

What Is Kubernetes ?

What is Kubernetes?

Kubernetes is software that automatically manages, scales, and maintains multi-container workloads in desired states

Modern software is increasingly run as fleets of containers, sometimes called microservices. A complete application may comprise many containers, all needing to work together in specific ways. Kubernetes is software that turns a collection of physical or virtual hosts (servers) into a platform that:
  • Hosts containerized workloads, providing them with compute, storage, and network resources, and
  • Automatically manages large numbers of containerized applications — keeping them healthy and available by adapting to changes and challenges

How does Kubernetes work?

  1. When developers create a multi-container application, they plan out how all the parts fit and work together, how many of each component should run, and roughly what should happen when challenges (e.g., lots of users logging in at once) are encountered.
  2. They store their containerized application components in a container registry (local or remote) and capture this thinking in one or several text files comprising a configuration. To start the application, they “apply” the configuration to Kubernetes.
  3. Kubernetes job is to evaluate and implement this configuration and maintain it until told otherwise. It:
    • Analyzes the configuration, aligning its requirements with those of all the other application configurations running on the system
    • Finds resources appropriate for running the new containers (e.g., some containers might need resources like GPUs that aren’t present on every host)
    • Grabs container images from the registry, starts up the new containers, and helps them connect to one another and to system resources (e.g., persistent storage), so the application works as a whole
  4. Then Kubernetes monitors everything, and when real events diverge from desired states, Kubernetes tries to fix things and adapt. For example, if a container crashes, Kubernetes restarts it. If an underlying server fails, Kubernetes finds resources elsewhere to run the containers that node was hosting. If traffic to an application suddenly spikes, Kubernetes can scale out containers to handle the additional load, in conformance to rules and limits stated in the configuration.

Why use Kubernetes?

Because it makes building and running complex applications much simpler. Here’s a handful of the many Kubernetes features:
  • Standard services like local DNS and basic load-balancing that most applications need, and are easy to use.
  • Standard behaviors (e.g., restart this container if it dies) that are easy to invoke, and do most of the work of keeping applications running, available, and performant.
  • A standard set of abstract “objects” (called things like “pods,” “replicasets,” and “deployments”) that wrap around containers and make it easy to build configurations around collections of containers.
  • A standard API that applications can call to easily enable more sophisticated behaviors, making it much easier to create applications that manage other applications.
The simple answer to “what is Kubernetes used for” is that it saves developers and operators a great deal of time and effort, and lets them focus on building features for their applications, instead of figuring out and implementing ways to keep their applications running well, at scale.

By keeping applications running despite challenges (e.g., failed servers, crashed containers, traffic spikes, etc.) Kubernetes also reduces business impacts, reduces the need for fire drills to bring broken applications back online, and protects against other liabilities, like the costs of failing to comply with Service Level Agreements (SLAs).

Where can I run Kubernetes?

Kubernetes also runs almost anywhere, on a wide range of Linux operating systems (worker nodes can also run on Windows Server). A single Kubernetes cluster can span hundreds of bare-metal or virtual machines in a datacenter, private, or any public cloud. Kubernetes can also run on developer desktops, edge servers, microservers like Raspberry Pis, or very small mobile and IoT devices and appliances.

With some forethought (and the right product and architectural choices) Kubernetes can even provide a functionally-consistent platform across all these infrastructures. This means that applications and configurations composed and initially tested on a desktop Kubernetes can move seamlessly and quickly to more-formal testing, large-scale production, edge, or IoT deployments. In principle, this means that enterprises and organizations can build “hybrid” and “multi-clouds” across a range of platforms, quickly and economically solving capacity problems without lock-in.

What is a Kubernetes cluster?

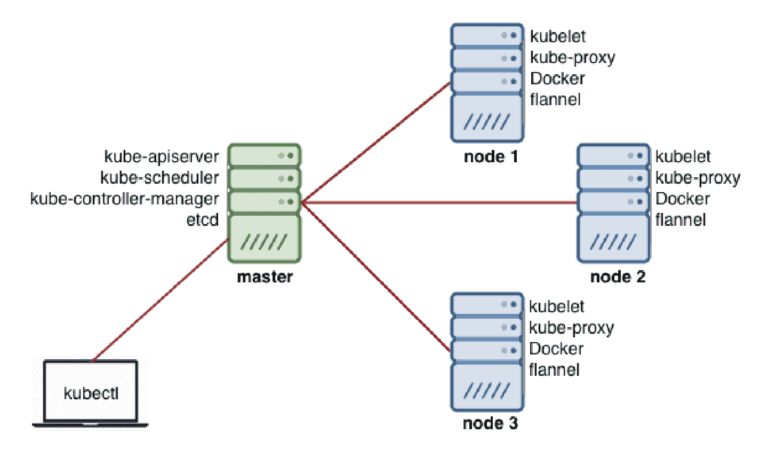
The K8s architecture is relatively simple. You never interact directly with the nodes hosting your application, but only with the control plane, which presents an API and is in charge of scheduling and replicating groups of containers named Pods. Kubectl is the command line interface that allows you to interact with the API to share the desired application state or gather detailed information on the infrastructure’s current state.

Let’s look at the various pieces.

Nodes

Each node that hosts part of your distributed application does so by leveraging Docker or a similar container technology, such as Rocket from CoreOS. The nodes also run two additional pieces of software: kube-proxy, which gives access to your running app, and kubelet, which receives commands from the k8s control plane. Nodes can also run flannel, an etcd backed network fabric for containers.

Master

The control plane itself runs the API server (kube-apiserver), the scheduler (kube-scheduler), the controller manager (kube-controller-manager) and etcd, a highly available key-value store for shared configuration and service discovery implementing the Raft consensus Algorithm. 
image thumbnail

What is “enterprise Kubernetes?”

Kubernetes, by itself, provides a core software framework for container and resource management, default services, plus an API. It’s engineered to be extensible via standard interfaces to provide important capabilities like:
  • Running containers – a container runtime or ‘engine’
  • Letting containers communicate – a container network
  • Providing persistent storage – a container storage solution
  • Routing inbound traffic to containers in a secure and orderly way – an ingress solution
  • Full-featured load balancing – distributing inbound traffic evenly to container workloads – via integration with an external load-balancing solution
… and many other components essential for efficient use and operations at scale. To make Kubernetes work at all — you or someone else needs to choose and integrate solutions to fill these critical slots.

Kubernetes alternatives made available free of charge typically select from among open source alternatives to provide these capabilities. These are often very good solutions for learning and small-scale use.

Organizations that want to use Kubernetes to run production software at scale need more, and more-mature functionality:
  • They need Kubernetes that’s feature-complete, hardened and secure, and easily integrated with centralized IT resources like directory services, monitoring and observability, notifications and ticketing, and so on.
  • They need Kubernetes that can be deployed, scaled, managed, and updated in consistent ways, perhaps across many different kinds of infrastructure.
  • They need all the different parts of Kubernetes to be validated together, and supported by a single vendor.
“Enterprise Kubernetes” refers to products and suites of products that answer these needs: that fill all of Kubernetes’ feature slots with best-of-breed solutions, solve problems of Kubernetes management across multiple infrastructures, enable consistency, and provide complete support.

How do I start using Kubernetes?

Mirantis makes several Kubernetes solutions, appropriate for different uses. Our open source products can be used free of charge, with community support. Our flagship products can be trialed free of charge and are available with tiered support up to fully-managed services.

Mirantis Container Cloud (formerly Docker Enterprise Container Cloud) is a solution for deploying, observing, managing, and non-disruptively updating Kubernetes (plus other applications that run on top of Kubernetes, like containerized OpenStack) on any infrastructure — ideal if you need to run Kubernetes reliably at scale with security, simplicity, and freedom of choice. (Download Mirantis Container Cloud)

Mirantis Kubernetes Engine (formerly Docker Enterprise/UCP) is fully-baked Enterprise Kubernetes for development, testing, and production. It includes the Universal Control Plane webUI for easy management, Mirantis Secure Registry (formerly Docker Trusted Registry) for private container image storage and security scanning, and runs on Mirantis Container Runtime (formerly Docker Engine – Enterprise) — a hardened container runtime with optional FIPS 140-2 encryption and other security and reliability features. (Download Mirantis Kubernetes Engine)

K0S – (pronounced “K-zeroes”) is zero-friction, open source Kubernetes that starts with a single command and runs on almost any Linux at almost any scale, from Raspberry Pis to giant datacenters. It’s our best choice for learners. (Download k0s – zero friction Kubernetes)

Finally, Lens – the open source Kubernetes IDE, accelerates Kubernetes learning and development. Lens lets you manage and interact with multiple Kubernetes clusters easily using a context-aware terminal, visualize object hierarchies inside them, view container logs, log directly into container command shells, and more. (Download Lens – the Kubernetes IDE)

How to deploy Kubernetes Dashboard quickly and easily


How to deploy Kubernetes Dashboard quickly and easily


Kubernetes offers a convenient graphical user interface with their web dashboard which can be used to create, monitor and manage a cluster. The installation is quite straightforward but takes a few steps to set up everything in a convenient manner.

In addition to deploying the dashboard, we’ll go over how to set up both admin and read-only access to the dashboard. However, before we begin, we need to have a working Kubernetes cluster. You can get started with Kubernetes by following our earlier tutorial.


1. Deploy the latest Kubernetes dashboard

Once you’ve set up your Kubernetes cluster or if you already had one running, we can get started.

The first thing to know about the web UI is that it can only be accessed using localhost address on the machine it runs on. This means we need to have an SSH tunnel to the server. For most OS, you can create an SSH tunnel using this command. Replace the <user> and <master_public_IP> with the relevant details to your Kubernetes cluster.

ssh -L localhost:8001:127.0.0.1:8001 <user>@<master_public_IP>

After you’ve logged in, you can deploy the dashboard itself with the following single command.

kubectl apply -f https://raw.githubusercontent.com/kubernetes/dashboard/v2.0.0/aio/deploy/recommended.yaml

If your cluster is working correctly, you should see an output confirming the creation of a bunch of Kubernetes components like in the example below.

namespace/kubernetes-dashboard created
serviceaccount/kubernetes-dashboard created
service/kubernetes-dashboard created
secret/kubernetes-dashboard-certs created
secret/kubernetes-dashboard-csrf created
secret/kubernetes-dashboard-key-holder created
configmap/kubernetes-dashboard-settings created
role.rbac.authorization.k8s.io/kubernetes-dashboard created
clusterrole.rbac.authorization.k8s.io/kubernetes-dashboard created
rolebinding.rbac.authorization.k8s.io/kubernetes-dashboard created
clusterrolebinding.rbac.authorization.k8s.io/kubernetes-dashboard created
deployment.apps/kubernetes-dashboard created
service/dashboard-metrics-scraper created
deployment.apps/dashboard-metrics-scraper created

Afterwards, you should have two new pods running on your cluster.

kubectl get pods -A
...
kubernetes-dashboard   dashboard-metrics-scraper-6b4884c9d5-v4z89   1/1     Running   0          30m
kubernetes-dashboard   kubernetes-dashboard-7b544877d5-m8jzk        1/1     Running   0          30m

You can then continue ahead with creating the required user accounts.

2. Creating Admin user

The Kubernetes dashboard supports a few ways to manage access control. In this example, we’ll be creating an admin user account with full privileges to modify the cluster and using tokens.

Start by making a new directory for the dashboard configuration files.

mkdir ~/dashboard && cd ~/dashboard

Create the following configuration and save it as dashboard-admin.yaml file. Note that indentation matters in the YAML files which should use two spaces in a regular text editor.

nano dashboard-admin.yaml
apiVersion: v1
kind: ServiceAccount
metadata:
  name: admin-user
  namespace: kubernetes-dashboard
---
apiVersion: rbac.authorization.k8s.io/v1
kind: ClusterRoleBinding
metadata:
  name: admin-user
roleRef:
  apiGroup: rbac.authorization.k8s.io
  kind: ClusterRole
  name: cluster-admin
subjects:
- kind: ServiceAccount
  name: admin-user
  namespace: kubernetes-dashboard

Once set, save the file and exit the editor.

Then deploy the admin user role with the next command.

kubectl apply -f dashboard-admin.yaml

You should see a service account and a cluster role binding created.

serviceaccount/admin-user created
clusterrolebinding.rbac.authorization.k8s.io/admin-user created

Using this method doesn’t require setting up or memorising passwords, instead, accessing the dashboard will require a token.

Get the admin token using the command below.

kubectl get secret -n kubernetes-dashboard $(kubectl get serviceaccount admin-user -n kubernetes-dashboard -o jsonpath="{.secrets[0].name}") -o jsonpath="{.data.token}" | base64 --decode

You’ll then see an output of a long string of seemingly random characters like in the example below.

eyJhbGciOiJSUzI1NiIsImtpZCI6Ilk2eEd2QjJMVkhIRWNfN2xTMlA5N2RNVlR5N0o1REFET0dp
dkRmel90aWMifQ.eyJpc3MiOiJrdWJlcm5ldGVzL3NlcnZpY2VhY2NvdW50Iiwia3ViZXJuZXRlc
y5pby9zZXJ2aWNlYWNjb3VudC9uYW1lc3BhY2UiOiJrdWJlcm5ldGVzLWRhc2hib2FyZCIsImt1Y
mVybmV0ZXMuaW8vc2VydmljZWFjY291bnQvc2VjcmV0Lm5hbWUiOiJhZG1pbi11c2VyLXRva2VuL
XEyZGJzIiwia3ViZXJuZXRlcy5pby9zZXJ2aWNlYWNjb3VudC9zZXJ2aWNlLWFjY291bnQubmFtZ
SI6ImFkbWluLXVzZXIiLCJrdWJlcm5ldGVzLmlvL3NlcnZpY2VhY2NvdW50L3NlcnZpY2UtYWNjb
3VudC51aWQiOiI1ODI5OTUxMS1hN2ZlLTQzZTQtODk3MC0yMjllOTM1YmExNDkiLCJzdWIiOiJze
XN0ZW06c2VydmljZWFjY291bnQ6a3ViZXJuZXRlcy1kYXNoYm9hcmQ6YWRtaW4tdXNlciJ9.GcUs
MMx4GnSV1hxQv01zX1nxXMZdKO7tU2OCu0TbJpPhJ9NhEidttOw5ENRosx7EqiffD3zdLDptS22F
gnDqRDW8OIpVZH2oQbR153EyP_l7ct9_kQVv1vFCL3fAmdrUwY5p1-YMC41OUYORy1JPo5wkpXrW
OytnsfWUbZBF475Wd3Gq3WdBHMTY4w3FarlJsvk76WgalnCtec4AVsEGxM0hS0LgQ-cGug7iGbmf
cY7odZDaz5lmxAflpE5S4m-AwsTvT42ENh_bq8PS7FsMd8mK9nELyQu_a-yocYUggju_m-BxLjgc
2cLh5WzVbTH_ztW7COlKWvSVbhudjwcl6w

The token is created each time the dashboard is deployed and is required to log into the dashboard. Note that the token will change if the dashboard is stopped and redeployed.

3. Creating Read-Only user

If you wish to provide access to your Kubernetes dashboard, for example, for demonstrative purposes, you can create a read-only view for the cluster.

Similarly to the admin account, save the following configuration in dashboard-read-only.yaml

nano dashboard-read-only.yaml
apiVersion: v1
kind: ServiceAccount
metadata:
  name: read-only-user
  namespace: kubernetes-dashboard
---
apiVersion: rbac.authorization.k8s.io/v1
kind: ClusterRole
metadata:
  annotations:
    rbac.authorization.kubernetes.io/autoupdate: "true"
  labels:
  name: read-only-clusterrole
  namespace: default
rules:
- apiGroups:
  - ""
  resources: ["*"]
  verbs:
  - get
  - list
  - watch
- apiGroups:
  - extensions
  resources: ["*"]
  verbs:
  - get
  - list
  - watch
- apiGroups:
  - apps
  resources: ["*"]
  verbs:
  - get
  - list
  - watch
---
apiVersion: rbac.authorization.k8s.io/v1
kind: ClusterRoleBinding
metadata:
  name: read-only-binding
roleRef:
  kind: ClusterRole
  name: read-only-clusterrole
  apiGroup: rbac.authorization.k8s.io
subjects:
- kind: ServiceAccount
  name: read-only-user
  namespace: kubernetes-dashboard

Once set, save the file and exit the editor.

Then deploy the read-only user account with the command below.

kubectl apply -f dashboard-read-only.yaml

To allow users to log in via the read-only account, you’ll need to provide a token which can be fetched using the next command.

kubectl get secret -n kubernetes-dashboard $(kubectl get serviceaccount read-only-user -n kubernetes-dashboard -o jsonpath="{.secrets[0].name}") -o jsonpath="{.data.token}" | base64 --decode

The toke will be a long series of characters and unique to the dashboard currently running.

4. Accessing the dashboard

We’ve now deployed the dashboard and created user accounts for it. Next, we can get started managing the Kubernetes cluster itself.

However, before we can log in to the dashboard, it needs to be made available by creating a proxy service on the localhost. Run the next command on your Kubernetes cluster.

kubectl proxy

This will start the server at 127.0.0.1:8001 as shown by the output.

Starting to serve on 127.0.0.1:8001

Now, assuming that we have already established an SSH tunnel binding to the localhost port 8001 at both ends, open a browser to the link below.

http://localhost:8001/api/v1/namespaces/kubernetes-dashboard/services/https:kubernetes-dashboard:/proxy/

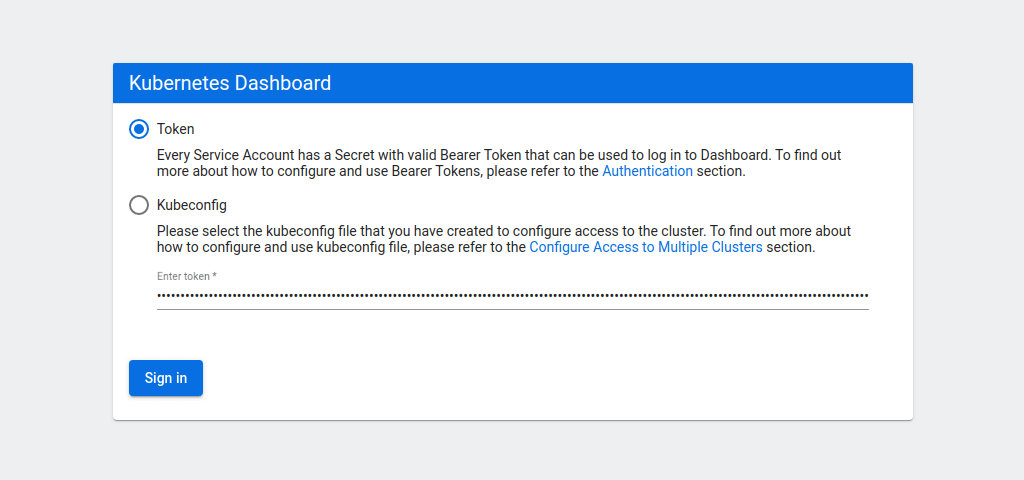
If everything is running correctly, you should see the dashboard login window.

Signing in to Kubernetes dashboard

Select the token authentication method and copy your admin token into the field below. Then click the Sign in button.

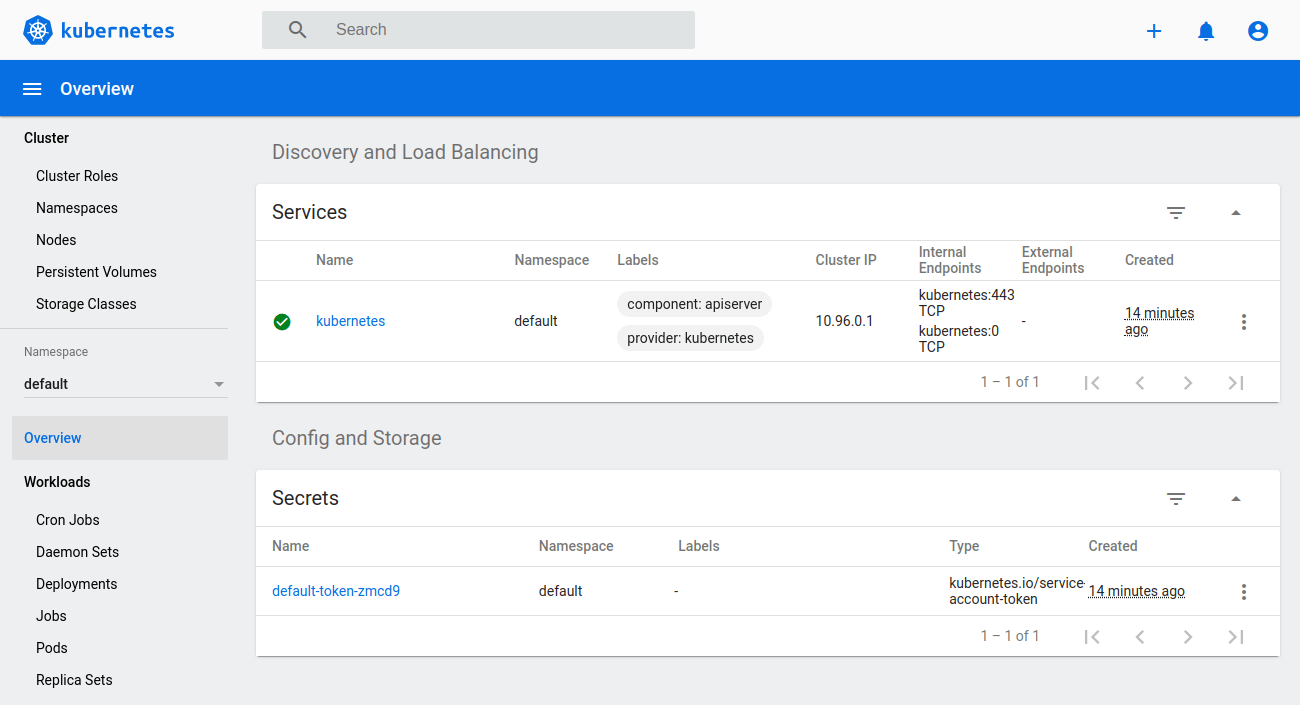
You will then be greeted by the overview of your Kubernetes cluster.

Kubernetes dashboard overview

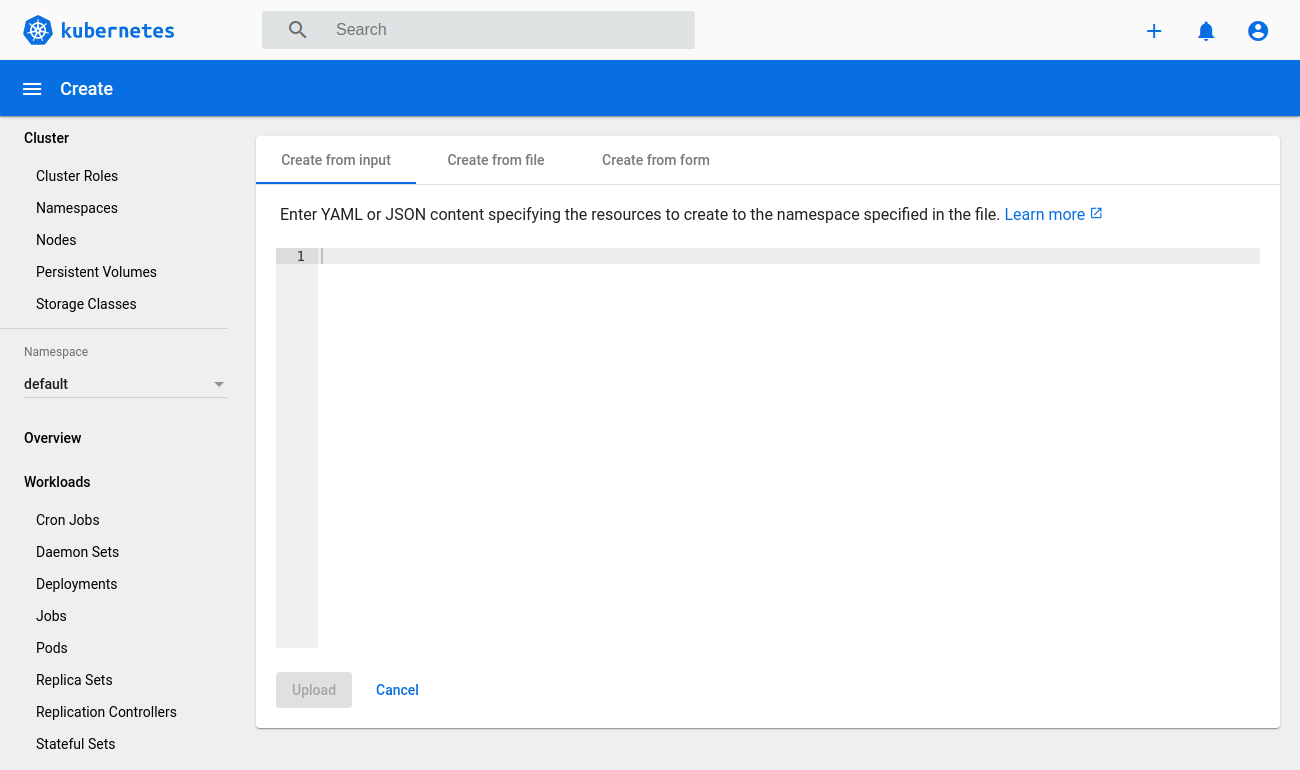
While signed in as an admin, you can deploy new pods and services quickly and easily by clicking the plus icon at the top right corner of the dashboard.

Creating new from input on Kubernetes dashboard

Then either copy in any configuration file you wish, select the file directly from your machine or create a new configuration from a form.

5. Stopping the dashboard

User roles that are no longer needed can be removed using the delete method.

kubectl delete -f dashboard-admin.yaml
kubectl delete -f dashboard-read-only.yaml

Likewise, if you want to disable the dashboard, it can be deleted just like any other deployment.

kubectl delete -f https://raw.githubusercontent.com/kubernetes/dashboard/v2.0.0/aio/deploy/recommended.yaml

The dashboard can then be redeployed at any time following the same procedure as before.

6. Setting up management script

The steps to deploy or delete the dashboard are not complicated but they can be further simplified.

The following script can be used to start, stop or check the dashboard status.

nano ~/dashboard/dashboard.sh
#!/bin/bash
showtoken=1
cmd="kubectl proxy"
count=`pgrep -cf "$cmd"`
dashboard_yaml="https://raw.githubusercontent.com/kubernetes/dashboard/v2.0.0/aio/deploy/recommended.yaml"
msgstarted="-e Kubernetes Dashboard \e[92mstarted\e[0m"
msgstopped="Kubernetes Dashboard stopped"

case $1 in
start)
   kubectl apply -f $dashboard_yaml >/dev/null 2>&1
   kubectl apply -f ~/dashboard/dashboard-admin.yaml >/dev/null 2>&1
   kubectl apply -f ~/dashboard/dashboard-read-only.yaml >/dev/null 2>&1

   if [ $count = 0 ]; then
      nohup $cmd >/dev/null 2>&1 &
      echo $msgstarted
   else
      echo "Kubernetes Dashboard already running"
   fi
   ;;

stop)
   showtoken=0
   if [ $count -gt 0 ]; then
      kill -9 $(pgrep -f "$cmd")
   fi
   kubectl delete -f $dashboard_yaml >/dev/null 2>&1
   kubectl delete -f ~/dashboard/dashboard-admin.yaml >/dev/null 2>&1
   kubectl delete -f ~/dashboard/dashboard-read-only.yaml >/dev/null 2>&1
   echo $msgstopped
   ;;

status)
   found=`kubectl get serviceaccount admin-user -n kubernetes-dashboard 2>/dev/null`
   if [[ $count = 0 ]] || [[ $found = "" ]]; then
      showtoken=0
      echo $msgstopped
   else
      found=`kubectl get clusterrolebinding admin-user -n kubernetes-dashboard 2>/dev/null`
      if [[ $found = "" ]]; then
         nopermission=" but user has no permissions."
         echo $msgstarted$nopermission
         echo 'Run "dashboard start" to fix it.'
      else
         echo $msgstarted
      fi
   fi
   ;;
esac

# Show full command line # ps -wfC "$cmd"
if [ $showtoken -gt 0 ]; then
   # Show token
   echo "Admin token:"
   kubectl get secret -n kubernetes-dashboard $(kubectl get serviceaccount admin-user -n kubernetes-dashboard -o jsonpath="{.secrets[0].name}") -o jsonpath="{.data.token}" | base64 --decode
   echo

   echo "User read-only token:"
   kubectl get secret -n kubernetes-dashboard $(kubectl get serviceaccount read-only-user -n kubernetes-dashboard -o jsonpath="{.secrets[0].name}") -o jsonpath="{.data.token}" | base64 --decode
   echo
fi

Once all set, save the file and exit the text editor.

Then make the script executable.

chmod +x ~/dashboard/dashboard.sh

Next, create a symbolic link to the dashboard script to be able to run it from anywhere on the system.

sudo ln -s ~/dashboard/dashboard.sh /usr/local/bin/dashboard

You can then use the following commands to run the dashboard like an application.

Start the dashboard and show the tokens

dashboard start

Check whether the dashboard is running or not and output the tokens if currently set.

dashboard status

Stop the dashboard

dashboard stop

Congratulations, you have successfully installed the Kubernetes dashboard! You can now start getting familiar with the dashboard by exploring the different menus and view it offers.

Install Helm 3 Linux - Setup Helm 3 on Linux | Install Helm 3 on Ubuntu | Setup Helm 3 on Linux | Setup Helm 3 on Ubuntu

What is Helm and How to install Helm  version  3? Helm is a package manager for Kubernetes.  Helm  is the K8s equivalent of yum or apt. I t ...